|
|
|
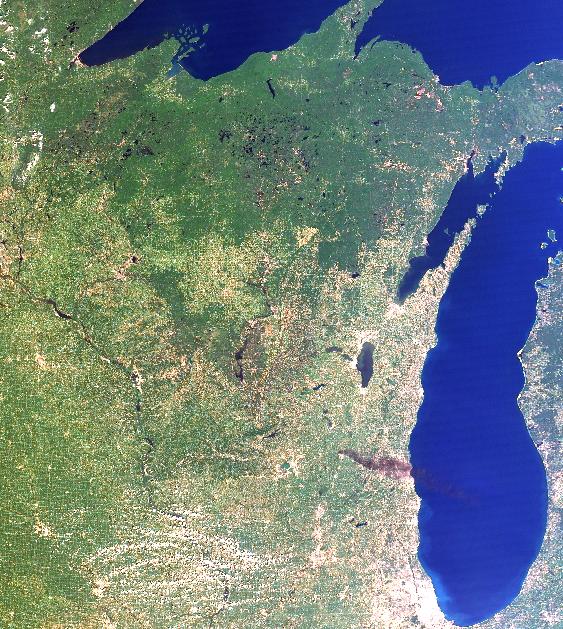
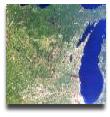
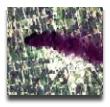
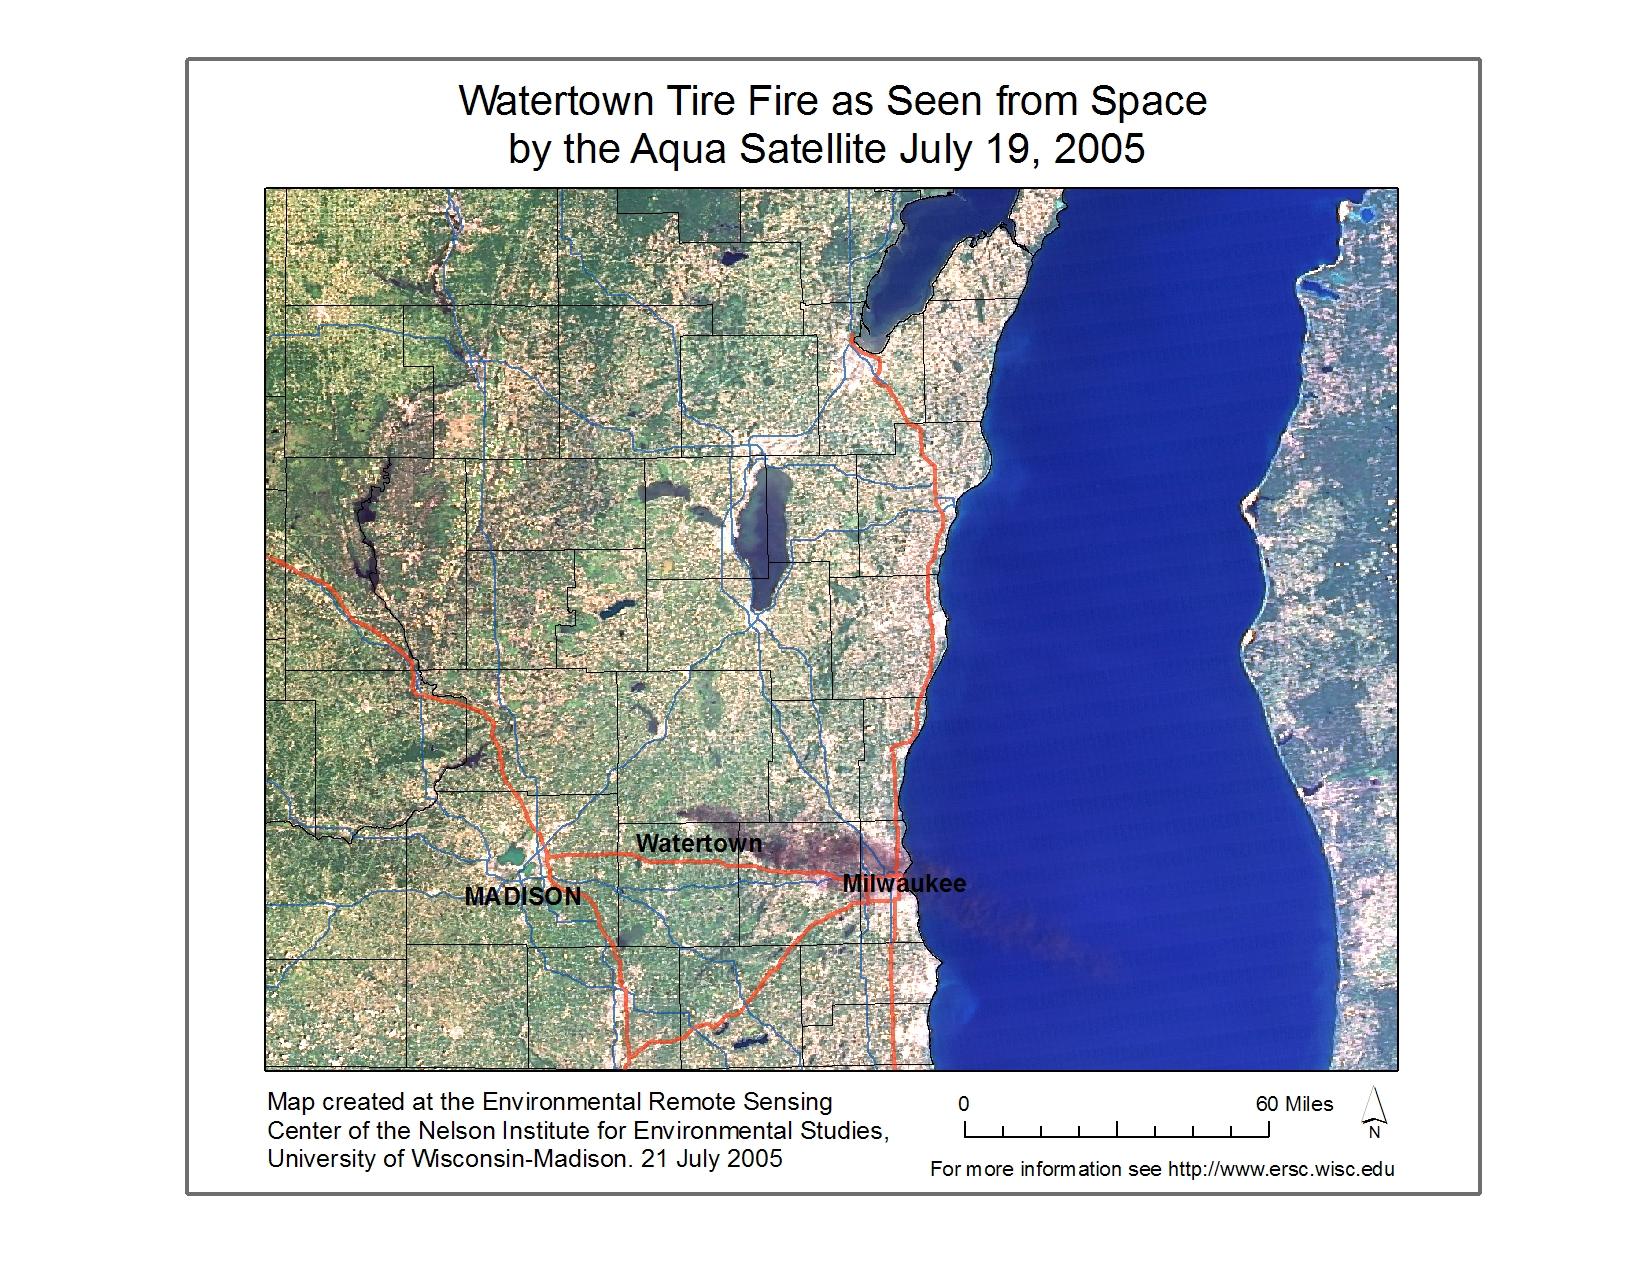
True-color image of Wisconsin, taken by the MODIS imaging system on NASA's "Aqua" satellite. MODIS collects imagery in
36 different bands of the electromagnetic spectrum, including visible light, near-infrared, mid-infrared, and
thermal-infrared wavelengths. This true-color image was created by displaying MODIS bands 1 (visible red wavelengths),
4 (visible green wavelengths), and 3 (visible blue wavelengths) in the same colors (red, green, and blue) on the
computer monitor. The image was acquired by the Aqua satellite at 2:20 PM (CDT) on July 19, 2005. (128 kB jpeg).
|

|
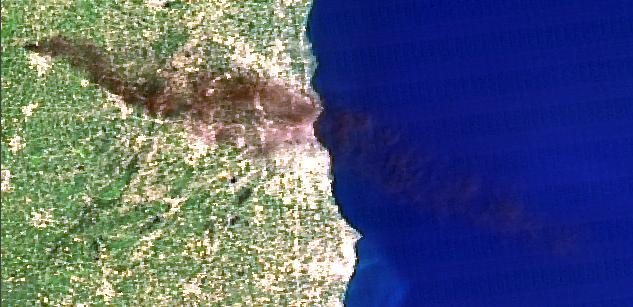
Enlargement of the above true-color Aqua MODIS image showing the smoke plume. (48 kB jpeg).
|

|
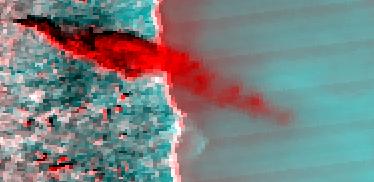
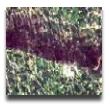
Principal Components image derived from Aqua MODIS data. Principal Components Analysis is a statistical technique that is
used here to maximize the differences among different feature types in the imagery. In this case, it helps increase the
apparent contrast between the smoke plume and the underlying land/water surface. (Note how difficult it is to see the
smoke plume over Lake Michigan in the above true-color imagery.) For this analysis, MODIS bands 1-5 and 8
were used in the PCA (click here for a technical description [14 kB
pdf]). The image here shows PCA bands 4 (displayed in red) and 3 (in green & blue).
(14 kB jpeg).
|
|
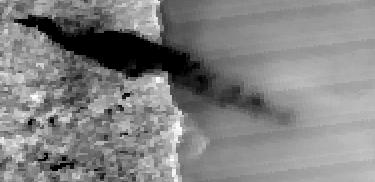
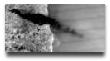
Principal Components image derived from Aqua MODIS data (see previous image caption for explanation). This image shows PCA
band 3 shown in black & white.
(11 kB jpeg).
|
|
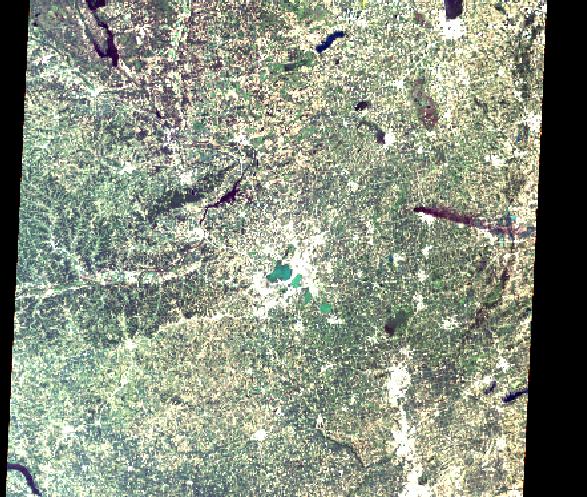
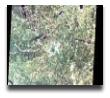
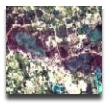
True-color image of southern Wisconsin, taken by the Thematic Mapper (TM) imaging system on the Landsat-5 satellite.
The Landsat TM collects imagery in 7 different bands of the electromagnetic spectrum, including visible light, near-infrared, mid-infrared, and thermal-infrared wavelengths. This true-color image was created by displaying TM bands 3 (visible red
wavelengths), 2 (visible green wavelengths), and 1 (visible blue wavelengths) in the same colors (red, green, and blue)
on the computer monitor. The image was acquired by Landsat-5 at 11:28 AM (CDT) on July 19, 2005.
(115 kB jpeg).
|
|
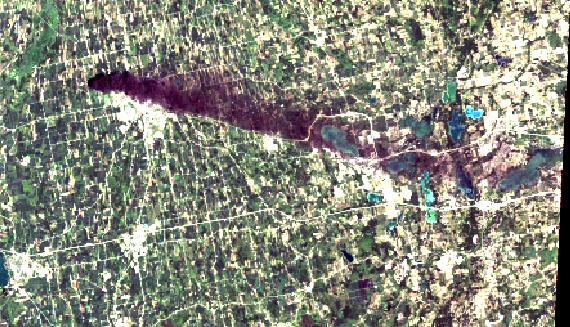
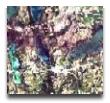
Enlargement of the above true-color Landsat image, showing the smoke plume (81 kB jpeg).
|
|
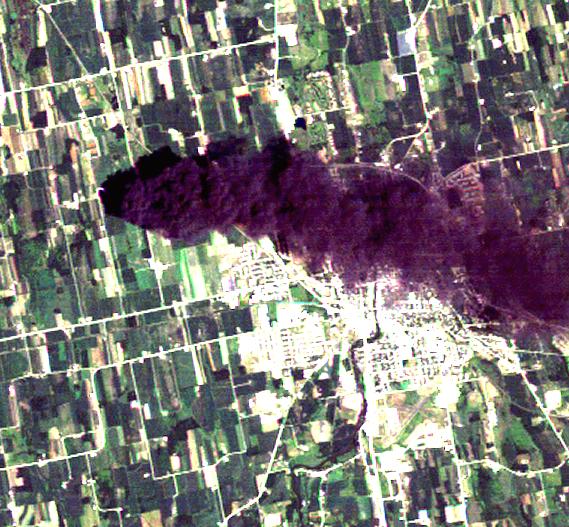
High-resolution enlargement of the true-color Landsat image, showing the area around Watertown, Wisconsin, where the fire was occurring (88 kB jpeg).
|
|
High-resolution enlargement of the true-color Landsat image, showing the area around Ixonia, Wisconsin (87 kB jpeg).
|
|
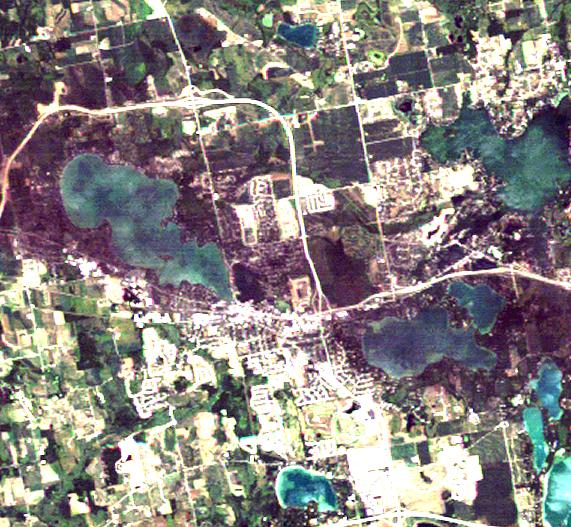
High-resolution enlargement of the true-color Landsat image, showing the area around Oconomowoc, Wisconsin (93 kB jpeg).
|
|
High-resolution enlargement of the true-color Landsat image, showing the area around Delafield, Wisconsin (101 kB jpeg).
|
|
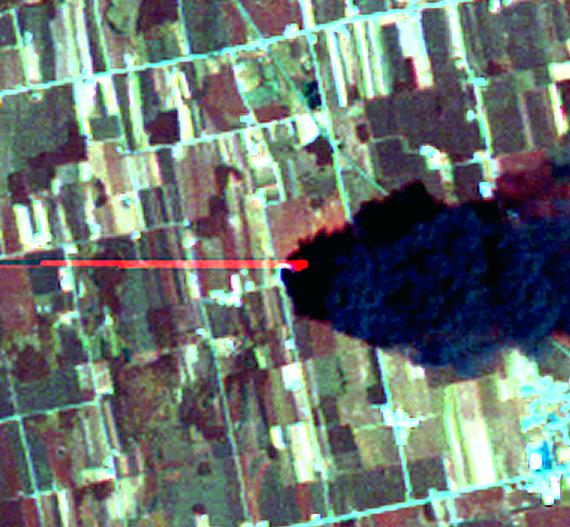
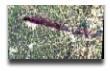
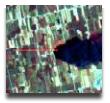
High-resolution enlargement of the Landsat image, showing the area around Watertown, Wisconsin, where the fire was occurring. This image is a false-color composite of TM bands 5 (mid-infrared wavelengths), 2 (visible green wavelengths) and 1 (visible blue wavelengths), displayed as red, green, and blue respectively. The prominent red "blob" represents heat being emitted by the fire. The fire's temperature was high enough to saturate the sensor's detector in band 5 (1550-1750 nm wavelength) as it scanned across the landscape. The bright line extending west from the fire represents a kind of "afterimage", where the sensor was temporarily "blinded" by the intense radiation from the blaze. (61 kB jpeg).
|
|
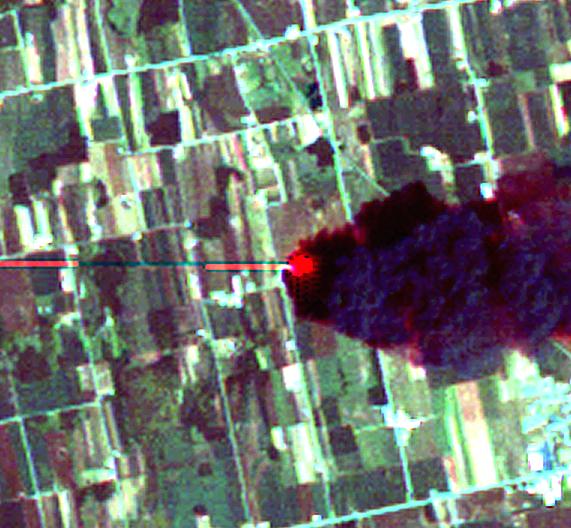
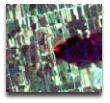
High-resolution enlargement of the Landsat image, showing the area around Watertown, Wisconsin, where the fire was occurring. This image is a false-color composite of TM bands 7 (mid-infrared wavelengths), 2 (visible green wavelengths) and 1 (visible blue wavelengths), displayed as red, green, and blue respectively. The prominent red "blob" represents heat being emitted by the fire. The fire's temperature was high enough to saturate the sensor's detector in band 7 (2080-2350 nm wavelength) as it scanned across the landscape. The bright line extending west from the fire represents a kind of "afterimage", where the sensor was temporarily "blinded" by the intense radiation from the blaze. (61 kB jpeg).
|
|
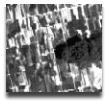
High-resolution enlargement of Landsat band #1 (visible blue wavelengths, 450-520 nm) (54 kB jpeg).
|
|
High-resolution enlargement of Landsat band #2 (visible green wavelengths, 520-600 nm). (56 kB jpeg).
|
|
High-resolution enlargement of Landsat band #3 (visible red wavelengths, 630-690 nm). (52 kB jpeg).
|
|
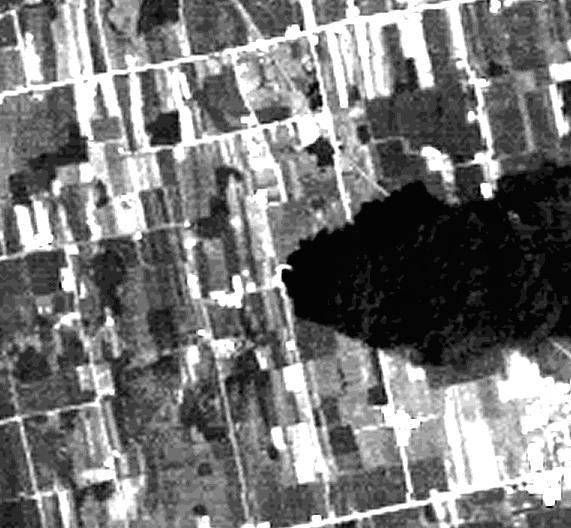
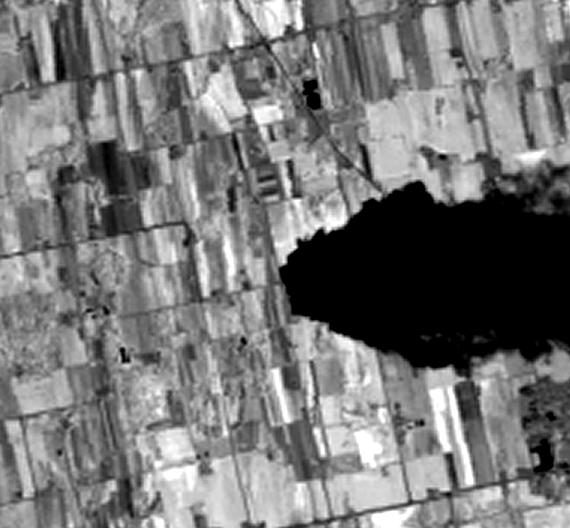
High-resolution enlargement of Landsat band #4 (near-infrared wavelengths, 760-790 nm). (40 kB jpeg).
|
|
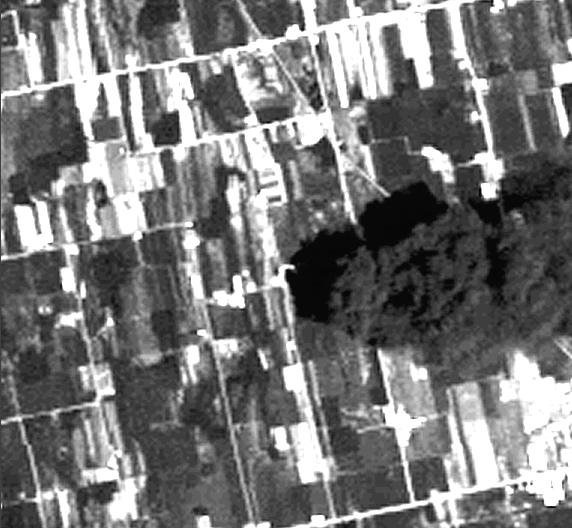
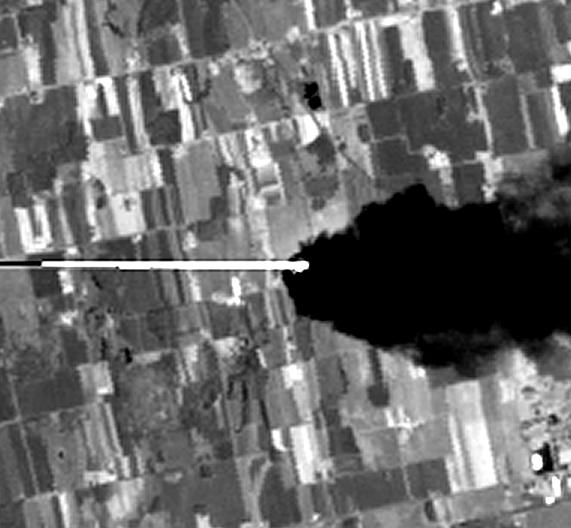
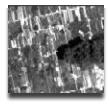
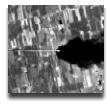
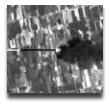
High-resolution enlargement of Landsat band #5 (mid-infrared wavelengths, 1550-1750 nm). The prominent white "blob" represents heat being emitted by the fire. The fire's temperature was high enough to saturate the sensor's detector as it scanned across the landscape. The bright line extending west from the fire represents a kind of "afterimage", where the sensor was temporarily "blinded" by the intense radiation from the blaze. (39 kB jpeg).
|
|
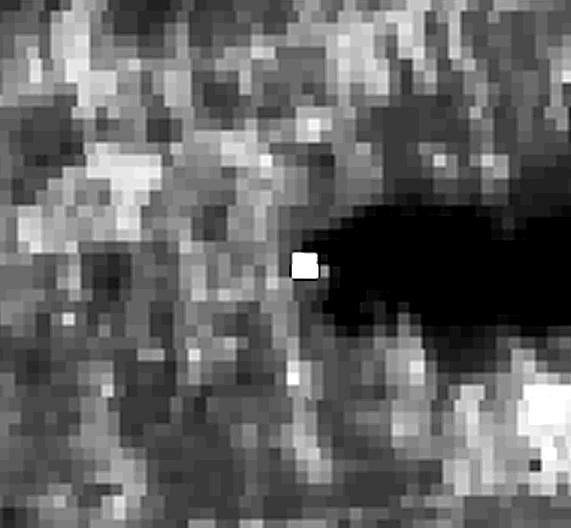
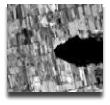
High-resolution enlargement of Landsat band #6 (thermal-infrared wavelengths, 10.4-12.5 micrometers). The prominent white "blob" represents heat being emitted by the fire. (29 kB jpeg).
|
|
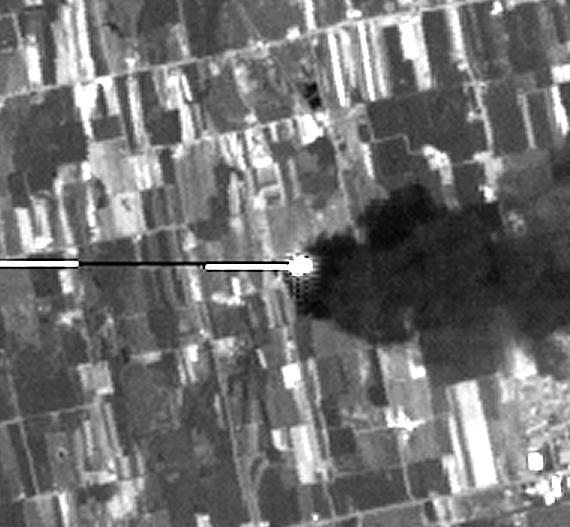
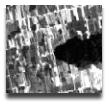
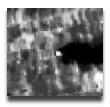
High-resolution enlargement of Landsat band #7 (mid-infrared wavelengths, 2080-2350 nm). The prominent white "blob" represents heat being emitted by the fire. The fire's temperature was high enough to saturate the sensor's detector as it scanned across the landscape. The bright line extending west from the fire represents a kind of "afterimage", where the sensor was temporarily "blinded" by the intense radiation from the blaze. (42 kB jpeg).
|

